Data Distribution
FedERA allows the option to train with either IID or non-IID data distribution. To specify the data distribution, you can use the “–iid” flag. When the flag is set to “1”, the data distribution is IID. However, if you set it to a value between “2-5”, the data distribution will be non-IID. Each argument value corresponds to a different non-IID distribution. The non-IID distributions are defined as follows:
def data_distribution(config, trainset):
    labels = []
    base_dir = os.getcwd()
    storepath = os.path.join(base_dir, 'Distribution/', config['dataset']+'/')
    seed = 10
    random.seed(seed)
    num_users = 5

    #Calculate the number of samples present per class
    for i in range(len(trainset)):
        labels.append(trainset[i][1])
    unique_labels = np.unique(np.array(labels))
    label_index_list = {}
    for key in unique_labels:
        label_index_list[key] = []
    for index, label in enumerate(labels):
        label_index_list[label].append(index)
    num_classes = len(unique_labels)

    #Calculate the value of the probability distribution. For K=1, it will be iid distribution
    K = config['niid']
    if (K==1):
        q_step = (1 - (1/num_classes))
    else:
        q_step = (1 - (1/num_classes))/(K-1)

    #Shuffle the index position for all classes
    for i in range(len(label_index_list)):
        random.shuffle(label_index_list[i])

    #Generate the different non-iid distribution. Data_presence_indicator will help to reduce the number of classes among the clients as the non-iid increases
    for j in range(K):
        dist = np.random.uniform(q_step, (1+j)*q_step, (num_classes, num_users))
        if j != 0:
            data_presence_indicator = np.random.choice([0, 1], (num_classes, num_users), p=[j*q_step, 1-(j*q_step)])
            if len(np.where(np.sum(data_presence_indicator, axis=0) == 0)[0])>0:
                for i in np.where(np.sum(data_presence_indicator, axis=0) == 0)[0]:
                    zero_array = data_presence_indicator[:,i]
                    zero_array[np.random.choice(len(zero_array),1)] =1
                    data_presence_indicator[:,i] = zero_array
            dist = np.multiply(dist,data_presence_indicator)
        psum = np.sum(dist, axis=1)
        for i in range(dist.shape[0]):
            dist[i] = dist[i]*len(label_index_list[i])/(psum[i]+0.00001)
        dist = np.floor(dist).astype(int)

        # If any client does not get any data then this logic helps to allocate the required samples among the clients
        gainers = list(np.where(np.sum(dist, axis=0) != 0))[0]
        if len(gainers) < num_users:
            losers = list(np.where(np.sum(dist, axis=0) == 0))[0]
            donors = np.random.choice(gainers, len(losers))
            for index, donor in enumerate(donors):
                avail_digits = np.where(dist[:,donor] != 0)[0]
                for digit in avail_digits:
                    transfer_frac = np.random.uniform(0.1,0.9)
                    num_transfer = int(dist[digit, donor]*transfer_frac)
                    dist[digit, donor] = dist[digit, donor] - num_transfer
                    dist[digit, losers[index]] = num_transfer

        #Logic to check if the summation of all the samples among the clients is equal to the total number of samples present for that class. If not it will adjust.
        for num in range(num_classes):
            while dist[num].sum() != len(label_index_list[num]):
                index = random.randint(0,num_users-1)
                if dist[num].sum() < len(label_index_list[num]):
                    dist[num][index]+=1
                else:
                    dist[num][index]-=1

        #Division of samples number among the clients
        split = [[] for i in range(num_classes)]
        for num in range(num_classes):
            start = 0
            for i in range(num_users):
                split[num].append(label_index_list[num][start:start+dist[num][i]])
                start = start+dist[num][i]

        #Division of actual data points among the clients.
        datapoints = [[] for i in range(num_users)]
        class_histogram = [[] for i in range(num_users)]
        class_stats= [[] for i in range(num_users)]
        for i in range(num_users):
            for num in range(num_classes):
                datapoints[i] += split[num][i]
                class_histogram[i].append(len(split[num][i]))
                if(len(split[num][i])==0):
                    class_stats[i].append(0)
                else:
                    class_stats[i].append(1)

        #Store the dataset division in the folder
        if not os.path.exists(storepath):
            os.makedirs(storepath)
        file_name = 'data_split_niid_'+ str(K)+'.pt'

        torch.save({'datapoints': datapoints, 'histograms': class_histogram, 'class_statitics': class_stats}, storepath + file_name)
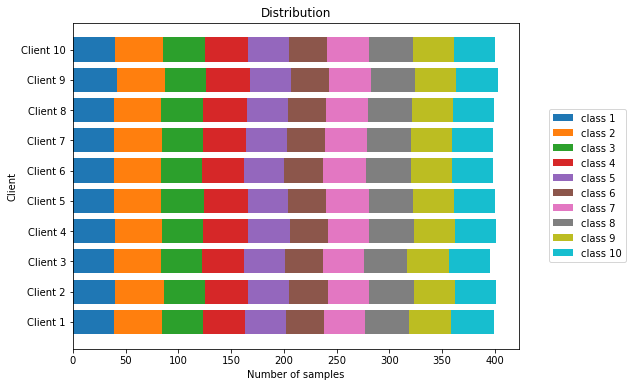
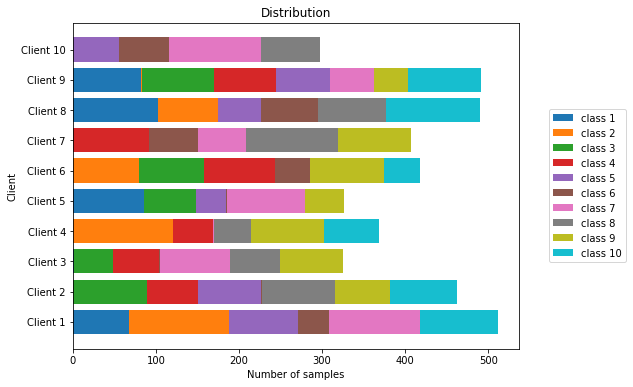
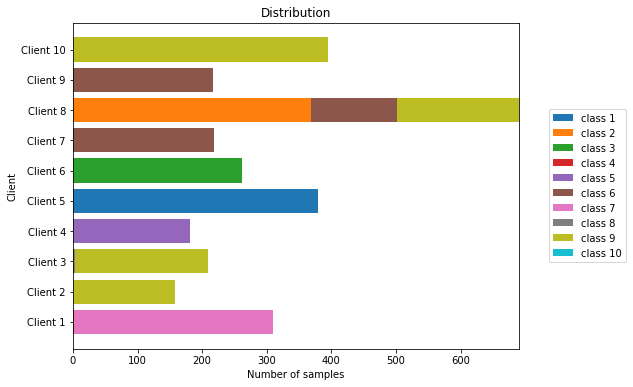
Visualizing the non-IID data distribution for MNIST dataset
Classwise distribution of samples among the clients for different non-IID distribution
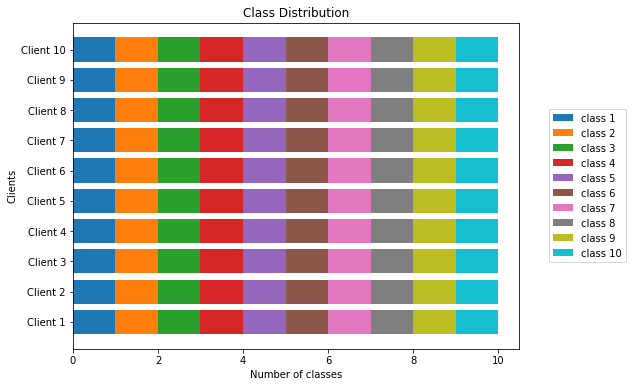
Classwise distribution of samples among the clients for non-IID distribution 1
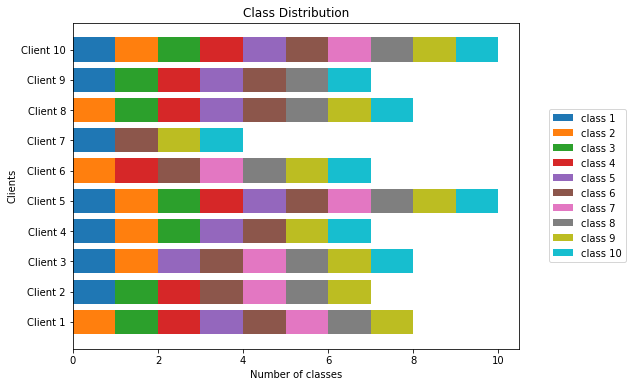
Classwise distribution of samples among the clients for non-IID distribution 2
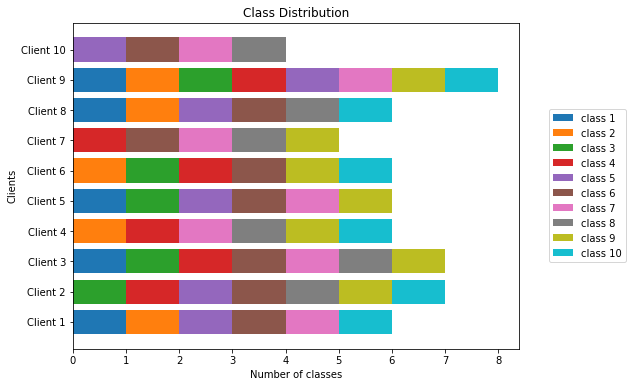
Classwise distribution of samples among the clients for non-IID distribution 3
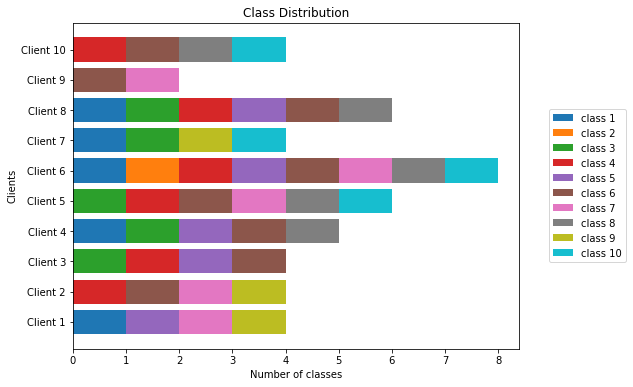
C lasswise distribution of samples among the clients for non-IID distribution 4

Classwise distribution of samples among the clients for non-IID distribution 5
Samplewise distribution of samples among the clients for different non-IID distribution
Samplewise distribution of samples among the clients for non-IID distribution 1

Samplewise distribution of samples among the clients for non-IID distribution 2
Samplewise distribution of samples among the clients for non-IID distribution 3

Samplewise distribution of samples among the clients for non-IID distribution 4
Samplewise distribution of samples among the clients for non-IID distribution 5